Selected editorial work
Roles include: Creative direction, visual storytelling, data graphics design, data visualization, UI/UX, original reporting, and project management
Tools include: Adobe Creative Suite, Figma, Datawrapper, Google Sheets, HTML, CSS, Mapbox, QGIS, ai2html, Ceros
Visual storytelling and data design

A Refugee’s Journey:
A tiny fraction of the world’s 27 million refugees are settled in the US. Here’s what that grueling path looks like.
A tiny fraction of the world’s 27 million refugees are settled in the US. Here’s what that grueling path looks like.
Role: Original reporting, creative direction, visual storytelling, data visualization
Award: Society of Illustrators 65 Silver Medal Winner Editorial Series, 2022; Society for News Design 44th Annual Award for excellence 2022; Longlist for Information is Beautiful 2022
Award: Society of Illustrators 65 Silver Medal Winner Editorial Series, 2022; Society for News Design 44th Annual Award for excellence 2022; Longlist for Information is Beautiful 2022
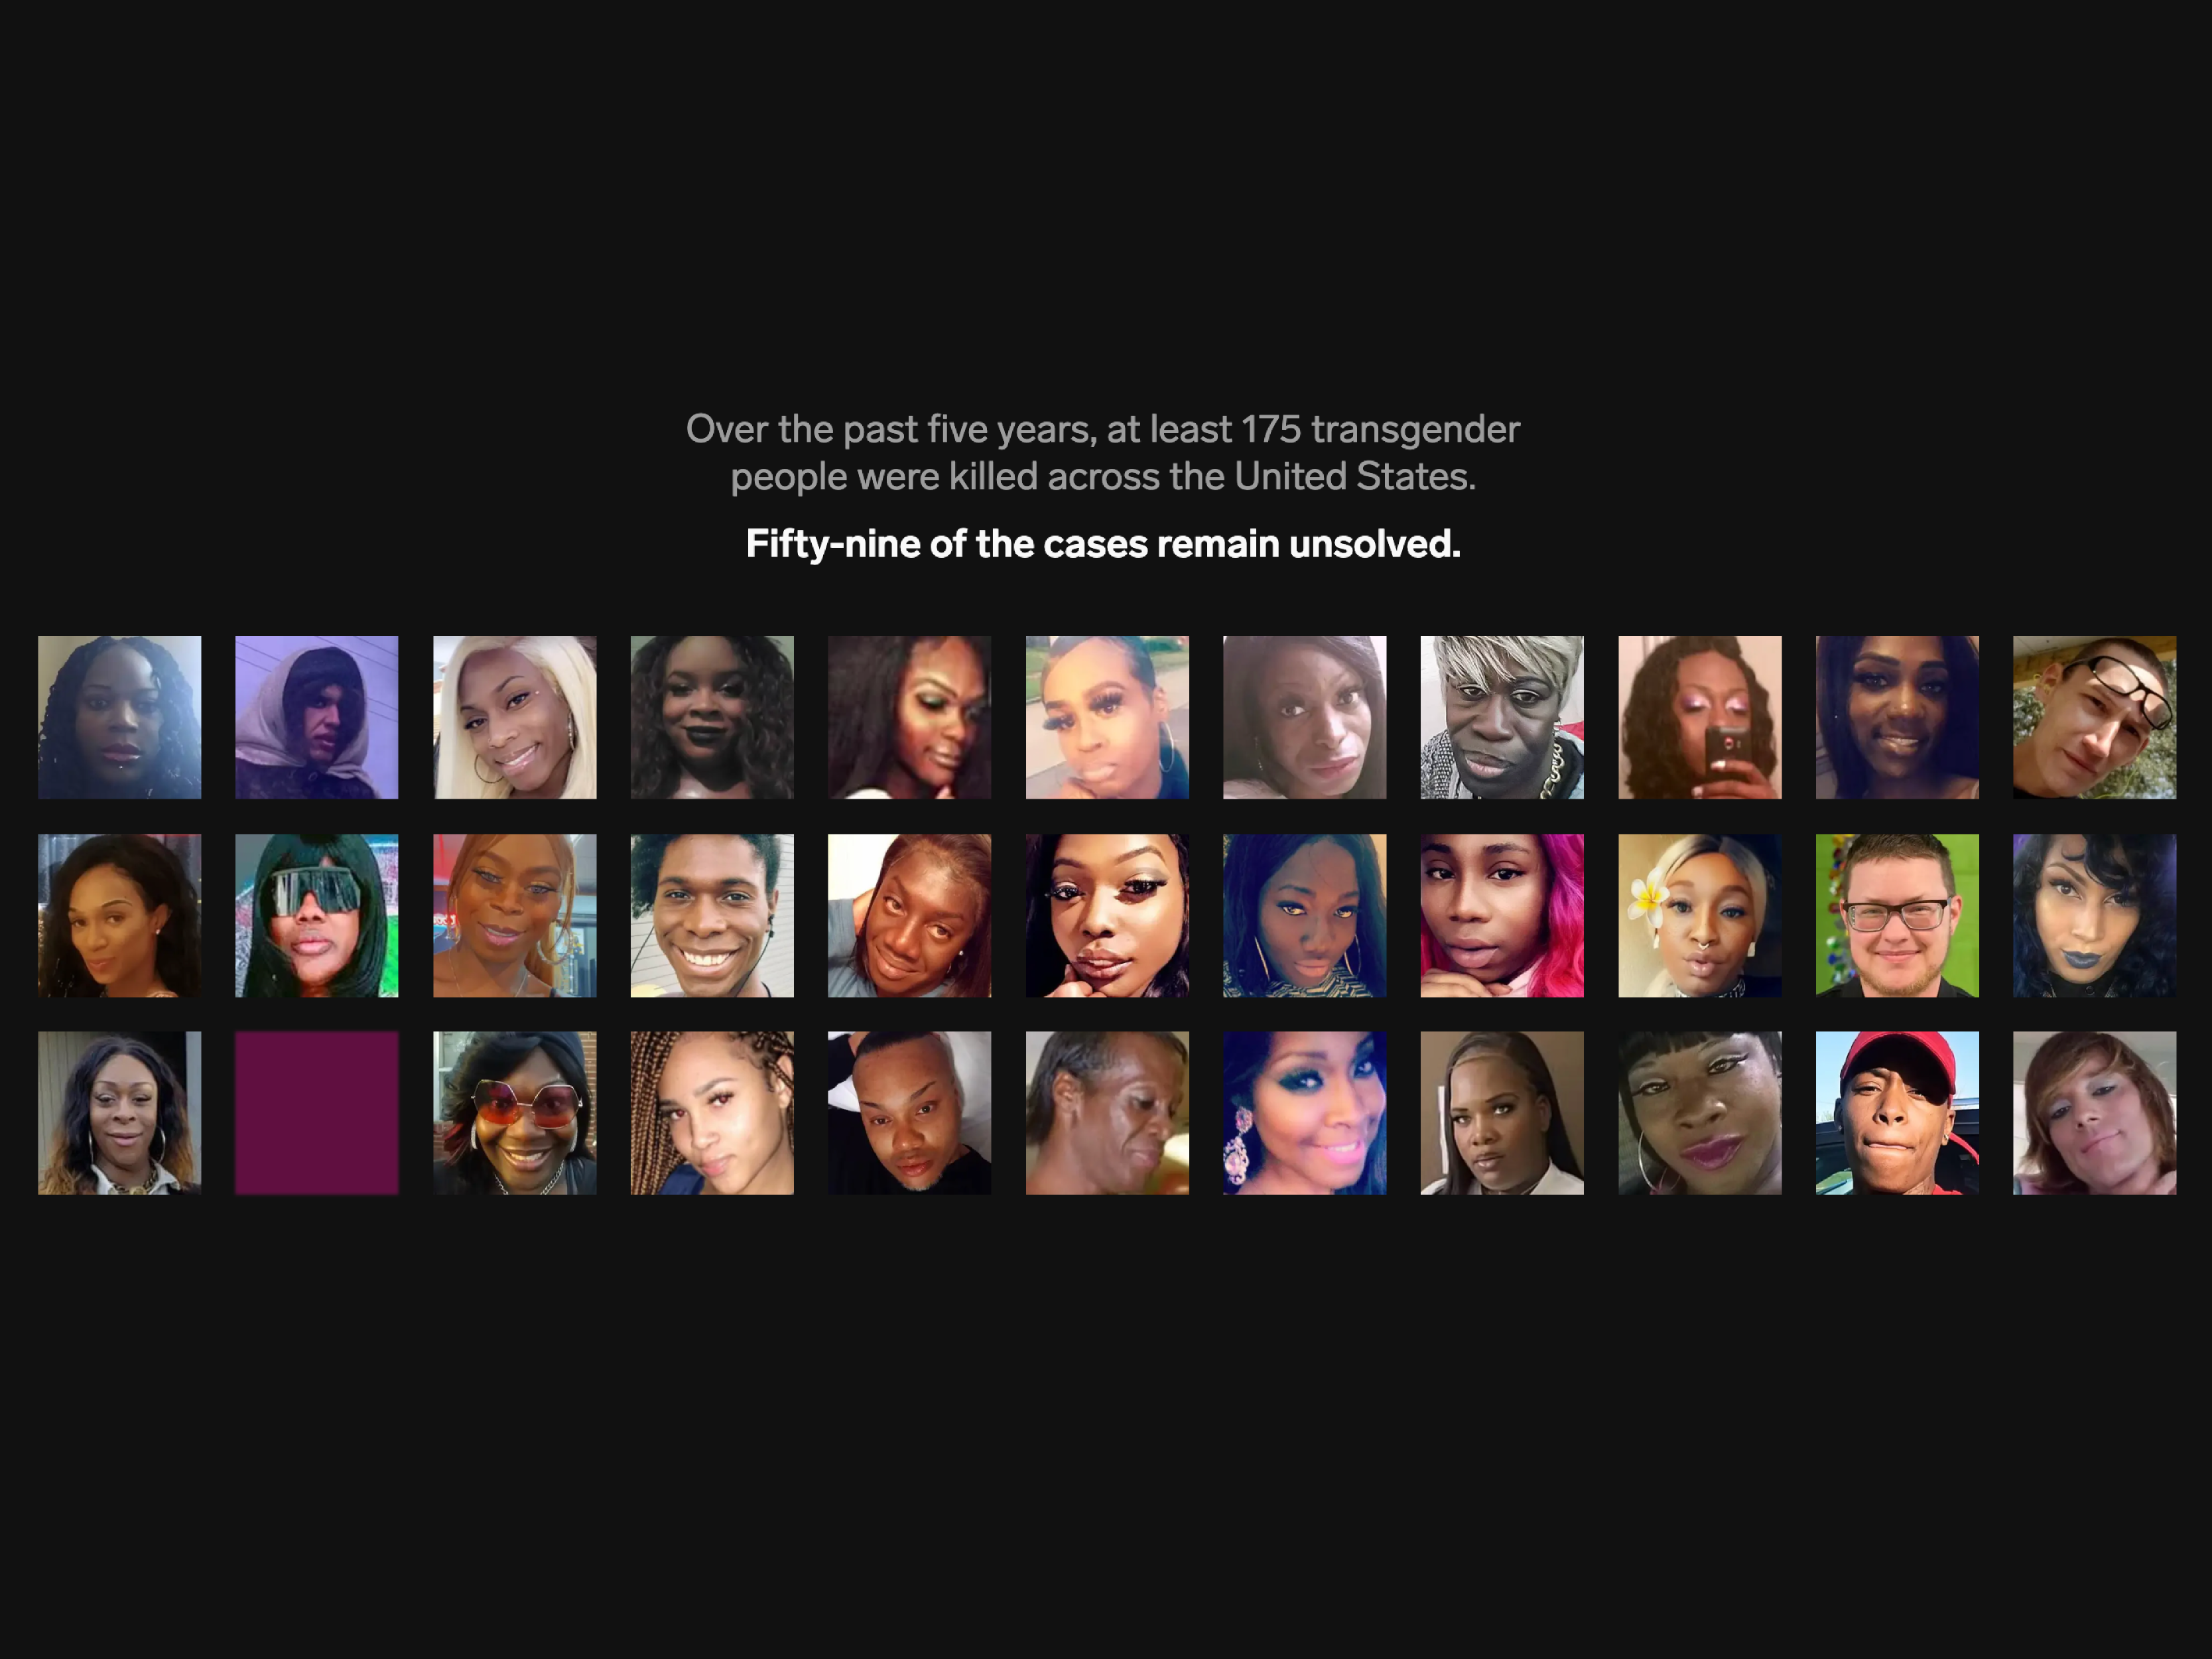
Deaths in the family:
Insider collected thousands of pages of documents to assemble the most comprehensive database of transgender homicides to date.
Insider collected thousands of pages of documents to assemble the most comprehensive database of transgender homicides to date.
Role:
Visual storytelling, UI/UX, data design, data visualization, project management
Award: Hillman Foundation Sidney Award, Dec. 2022; Shortlist for Sigma Awards 2023; Society for News Design 44th Annual Award for excellence 2022
Visual storytelling, UI/UX, data design, data visualization, project management
Award: Hillman Foundation Sidney Award, Dec. 2022; Shortlist for Sigma Awards 2023; Society for News Design 44th Annual Award for excellence 2022

Amazon warehouse injuries:
Amazon workers say minor aches suddenly became debilitating as they raced to meet speed targets. This is part of the editorial package “Warehouse Nation.”
Amazon workers say minor aches suddenly became debilitating as they raced to meet speed targets. This is part of the editorial package “Warehouse Nation.”
Role: Visual storytelling, UI/UX, data visualization, project management
Award: SABEW Award 2022; AJO Best Data Visualization Award 2023; EFJ Visual Design Award 2023
Award: SABEW Award 2022; AJO Best Data Visualization Award 2023; EFJ Visual Design Award 2023
Interactive data design and visualization

The oldest government in history:
America’s gerontocracy is disconnecting Congress from the rest of the country, an Insider data analysis reveals. This is part of the editorial package “Red, White, and Gray.”
Role: Data design, data visualization, project management
Award: SPJ Dateline Award Best online series finalist 2023
Award: SPJ Dateline Award Best online series finalist 2023

Rise of sports betting startups:
Sports betting's rise in the US has created a startup boom. Explore our database of 55 companies innovating in the industry, from microbetting to fantasy platforms.
Role: Creative direction, UI/UX, data design
Psychedelic clinical trial tracker:
About 100 experiments are in progress worldwide, examining psychedelics' potential as medicines. Insider identified 19 key trials that could make or break the psychedelics industry's future. If they succeed, these trials could pave the way for psychedelics to be used as medical treatments.
About 100 experiments are in progress worldwide, examining psychedelics' potential as medicines. Insider identified 19 key trials that could make or break the psychedelics industry's future. If they succeed, these trials could pave the way for psychedelics to be used as medical treatments.
Role: Creative direction, UI/UX, data design

Cloudverse 100:
Cloud computing has dominated the tech industry, created armfuls of multi-billion dollar companies, and it's still growing exponentially. A list of 100 people building the next generation of the internet.
Cloud computing has dominated the tech industry, created armfuls of multi-billion dollar companies, and it's still growing exponentially. A list of 100 people building the next generation of the internet.
Role: UI/UX, data design

Biden vs. Trump policy:
Where Donald Trump and Joe Biden stand on healthcare, taxes, abortion, and other key issues.
Where Donald Trump and Joe Biden stand on healthcare, taxes, abortion, and other key issues.
Role: Data design, data visualization

Halloween costume quiz (A fun time capsule of pop culture and some timeless Halloween costume inspiration bundled in an interactive quiz I designed and developed in 2019 ︎)
Role: Creative direction, UI/UX, data visualization
Breaking news maps, charts, and visualizations

Russia’s invasion of Ukraine:
Maps show the territory Ukraine has taken back after Russia's invasion.
Maps show the territory Ukraine has taken back after Russia's invasion.
Role: Data design, data visualization
Role: Data design, data visualization

Omicron death tolls:Countries where Omicron surged early have seen a relatively low burden of deaths so far. But early data suggests that the situation may be different in the US, experts warn.
Role: Data design, data visualization

Overturning of Roe v. Wade:
The US Supreme Court overturned Roe v. Wade, which granted the legal right to abortion in 1973. The court gutting Roe has returned control of abortion policy back to the states. These graphics show the state of abortion in the US and what could happen without Roe.
The US Supreme Court overturned Roe v. Wade, which granted the legal right to abortion in 1973. The court gutting Roe has returned control of abortion policy back to the states. These graphics show the state of abortion in the US and what could happen without Roe.
Role: Data design, data visualization
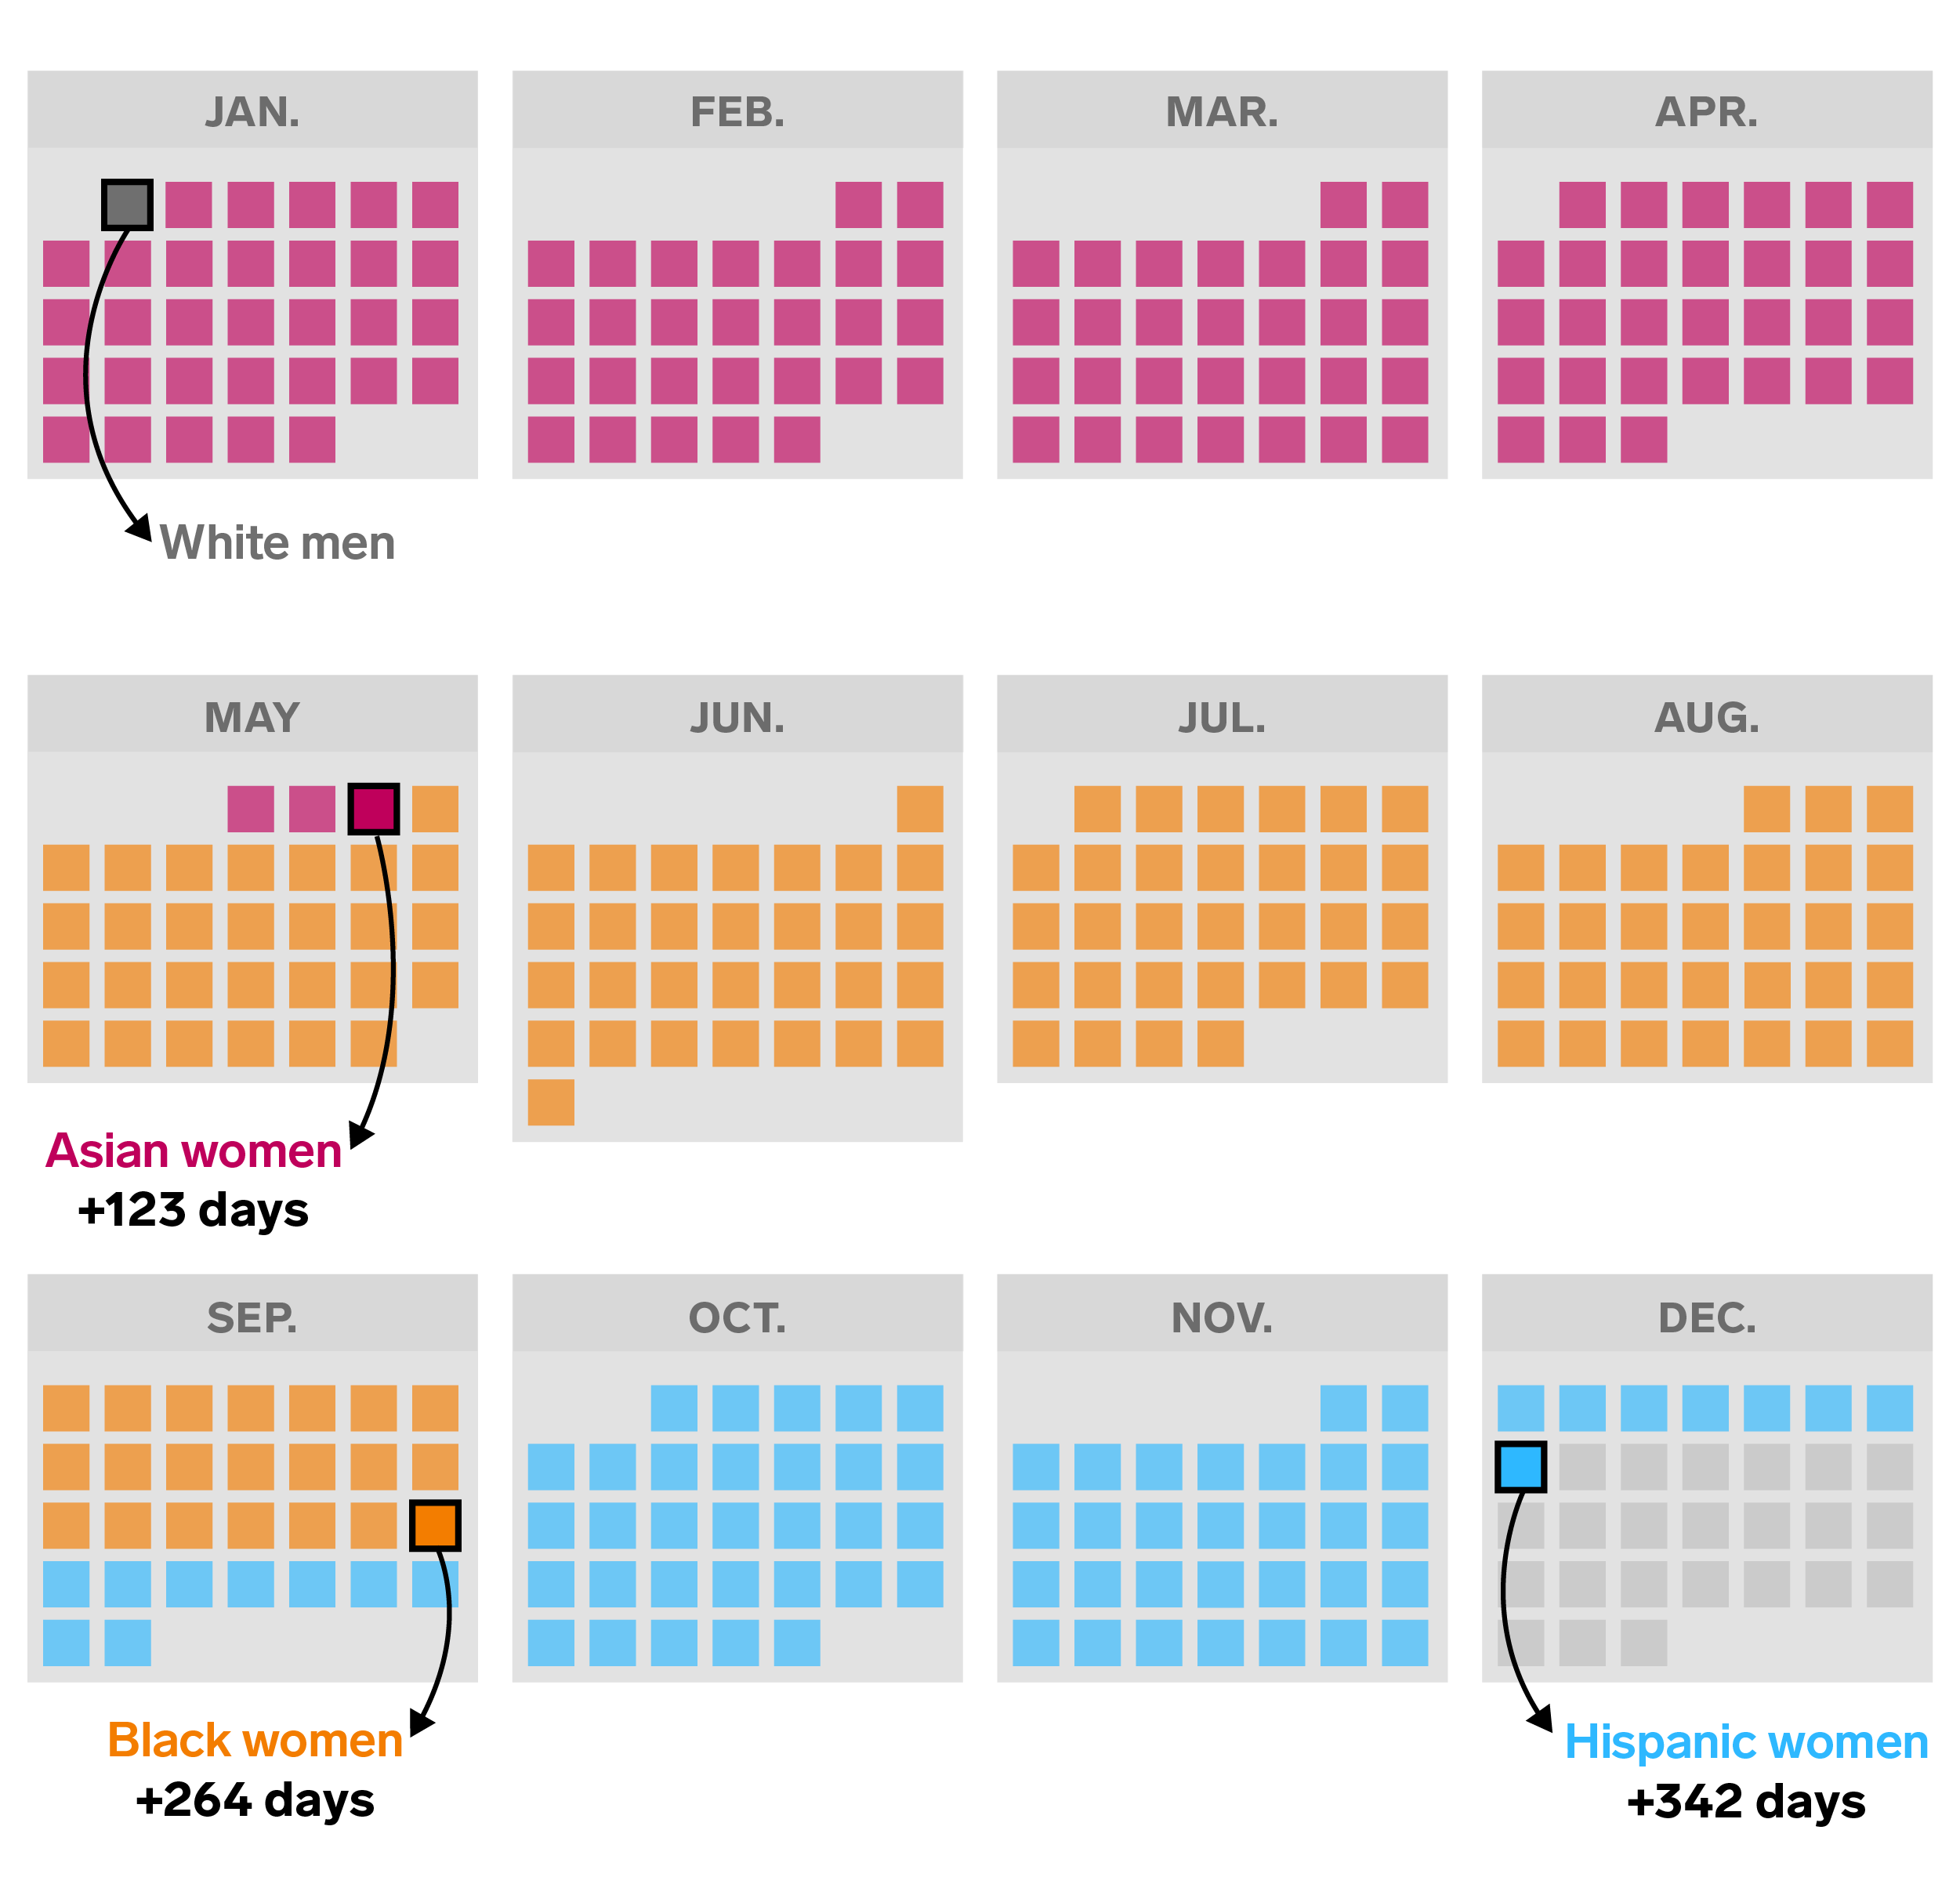
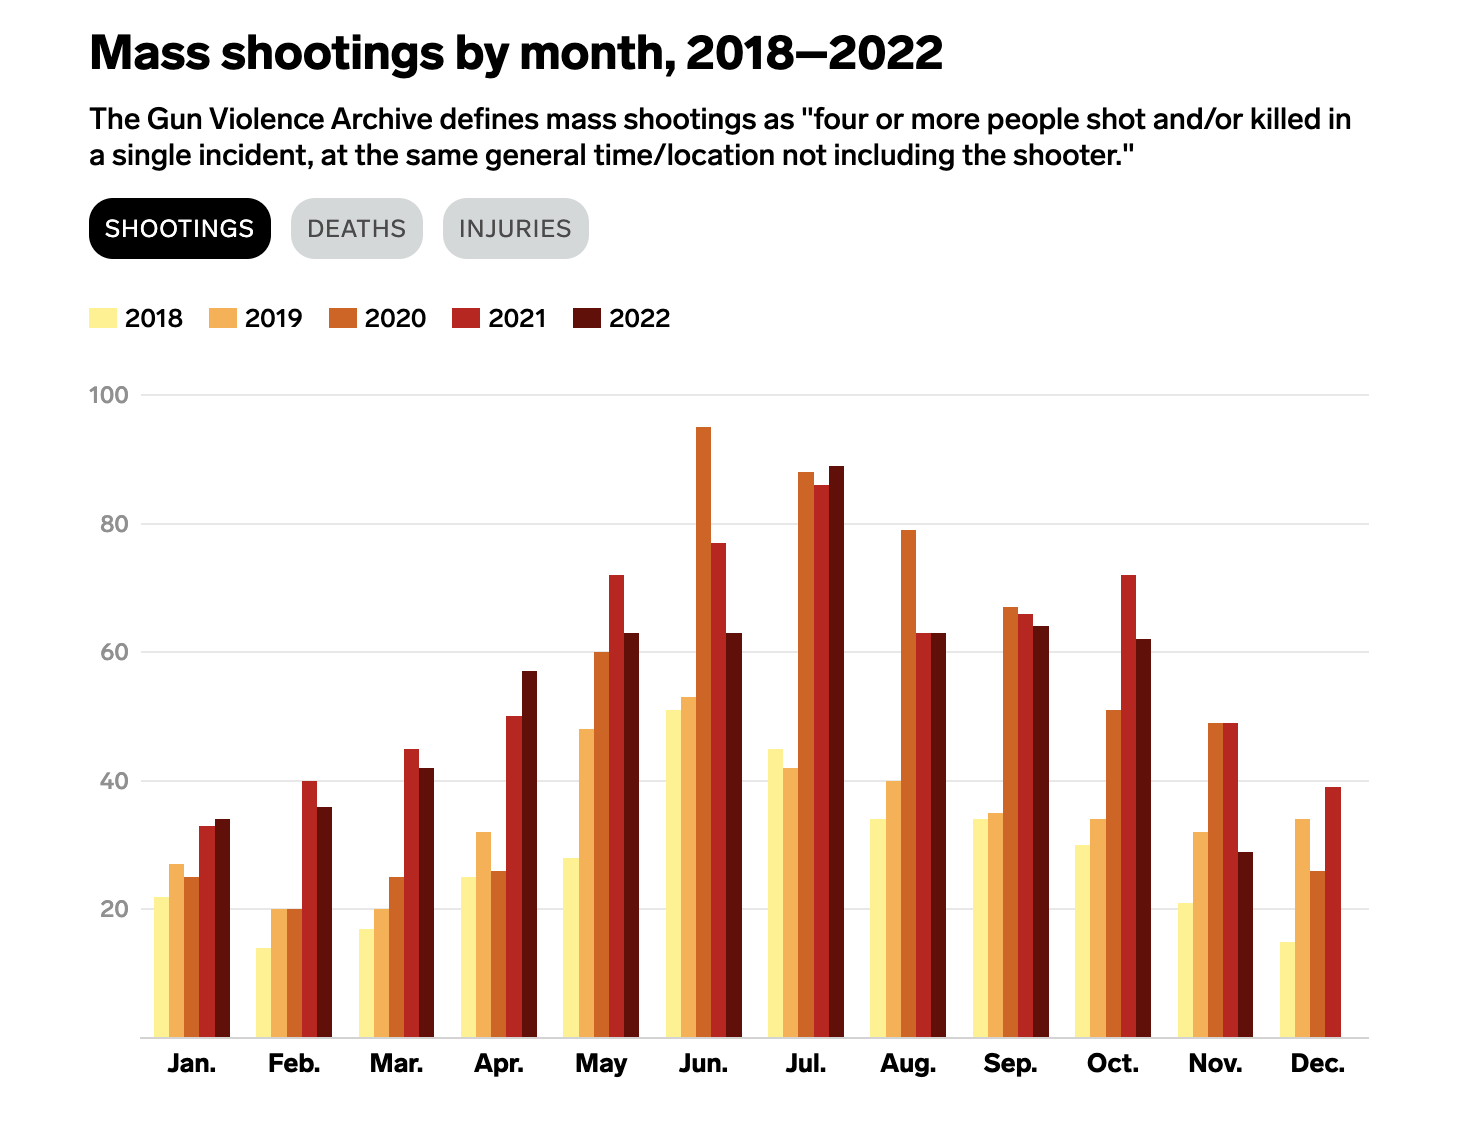
The numbers behind systemic racism in America:
Nationwide protests over the death of George Floyd in 2020 and the COVID-19 pandemic underscored the ways racism and racial inequality persist in modern American life. Data and research have extensively shown how Black Americans are underrepresented, overrepresented, or experience different treatment from their white counterparts.
Role: Data design, data visualization
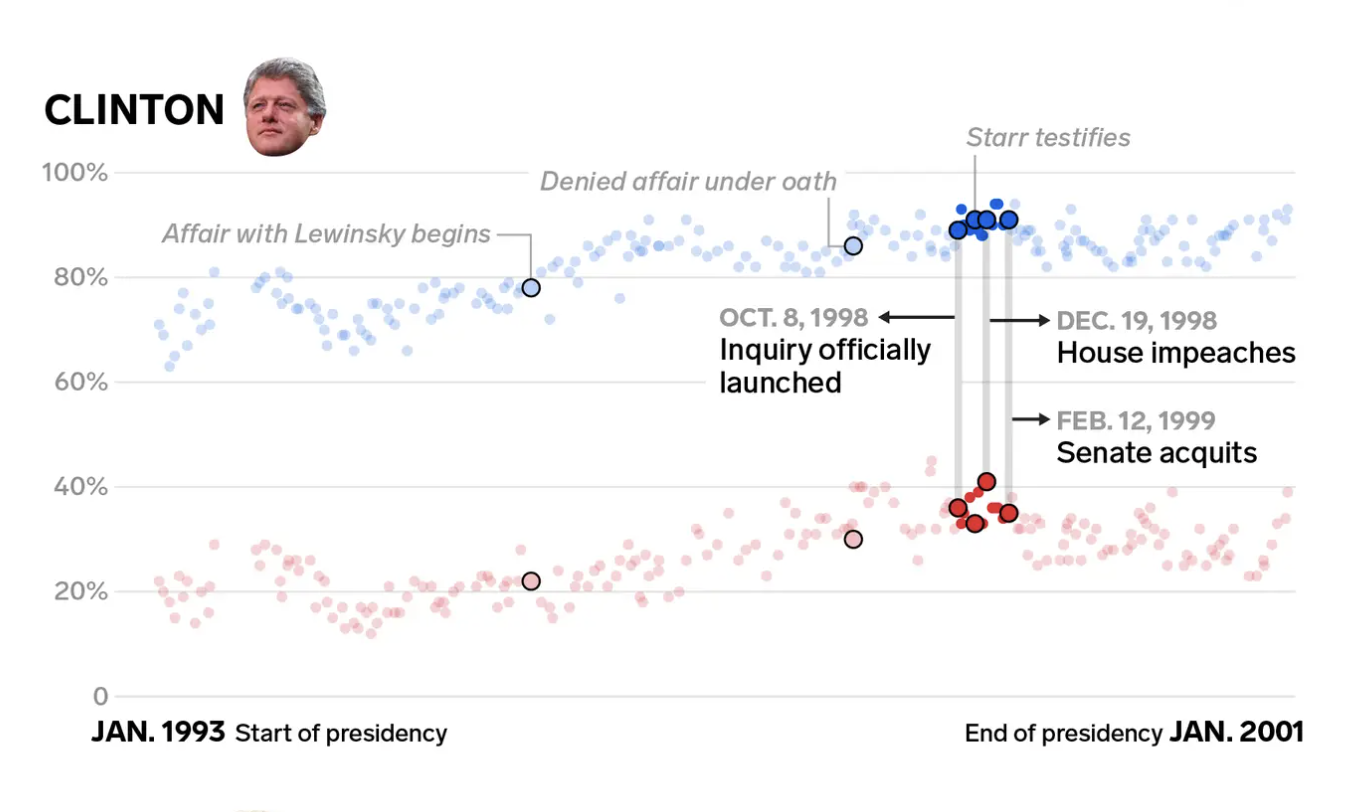
Impeachment approval ratings:
Impeachment crushed Nixon's approval ratings, but Clinton emerged unscathed. Here's how Trump could survive, too.
Impeachment crushed Nixon's approval ratings, but Clinton emerged unscathed. Here's how Trump could survive, too.
Role: Data design, data visualization